Mixed-data monitoring
Zago D., Capizzi G., Qiu P (202+). Effective Monitoring of Processes With Mixed Data by a Self-Starting CUSUM Chart. Submitted.
Traditionally, control charts are designed for either continuous or categorical quality variables, but not both. However, there are many applications where processes involve mixed data. Currently, there are only a few approaches available to handle such cases, mainly due to the difficulty of modeling the data-generating process. Existing methods often rely on data reduction or categorization, which results in a significant loss of information from the original data.
To overcome this limitation, we investigated a new methodology for monitoring the mean of a process with mixed data. The proposed method is based on the likelihood-ratio formulation of the CUSUM control chart, which estimates the conditional density of continuous quality variables given the values of categorical variables nonparametrically.
Let \(\mathbf{X}_{n} = (\mathbf{X}_{1n}, \mathbf{X}_{2n})\) represent the sequential observations to be monitored, where \(\mathbf{X}_{1n}\) is continuous and \(\mathbf{X}_{2n}\) is categorical. First, the continuous observations are whitened using the following transformation:
\[\mathbf{Z}_{1i|\mathbf{j}} = \left(\widehat{\Sigma}^{(0)}_{\mathbf{j}}\right)^{-1} \mathbf{X}_{1i} I(\mathbf{X}_{2i}=\mathbf{j}), \quad i \geq -m+1,\ \mathbf{j} \in \mathbf{J},\]where \(\widehat{\Sigma}^{(0)}_{\mathbf{j}}\) is the estimated covariance matrix for category \(\mathbf{j}\), and \(I(\mathbf{X}_{2i}=\mathbf{j})\) is an indicator function. Next, the control chart is computed as:
\[G_{n} = \max\left(0, G_{n-1} + \log \frac{\widehat{f}_1^{(n-1)}(\mathbf{Z}_{1n|\mathbf{X}_{2n}}, \mathbf{X}_{2n};\mathbf{\delta}_1, \mathbf{\delta}_2)} {\widehat{f}_0^{(n-1)}(\mathbf{Z}_{1n|\mathbf{X}_{2n}}, \mathbf{X}_{2n})}\right),\]where $\widehat{f}_0$ and $\widehat{f}_1$ represent the estimated conditional IC and OC densities, respectively. These densities are estimated using an adaptive kernel density estimation approach.
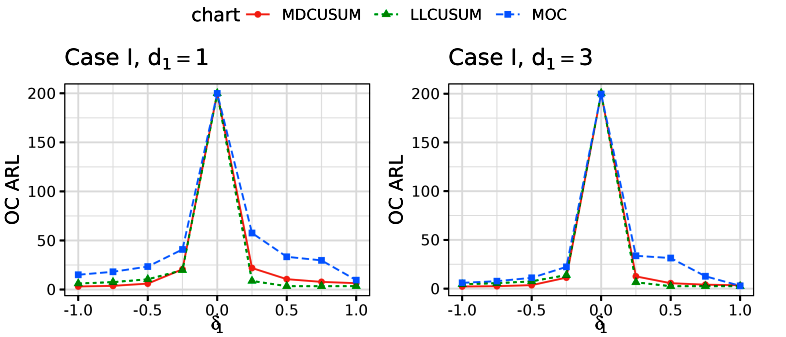
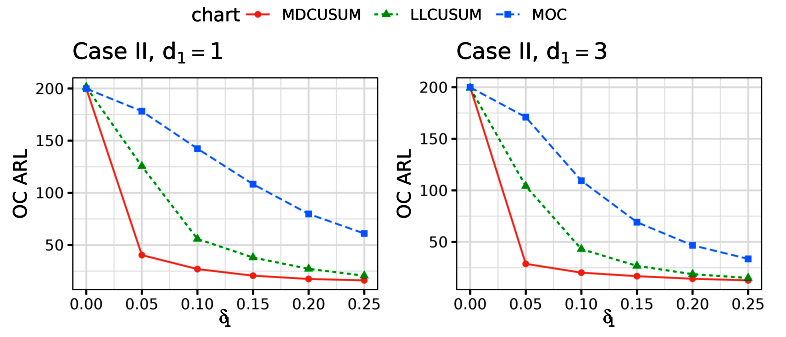
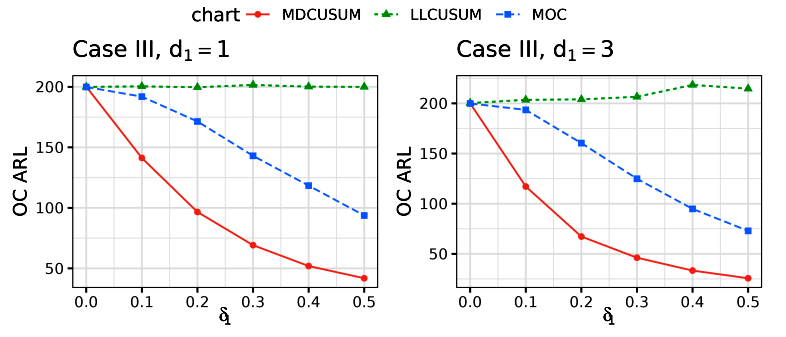
Unlike other methods in the literature, the proposed control chart based on the likelihood-ratio formulation takes full advantage of the information contained in the original data. Numerical studies conducted in this paper demonstrate the effectiveness of this chart in detecting mean shifts in processes with mixed data across various scenarios.